Have you ever found it hard to debug Streams in Java? Allow me to introduce you to a very powerful tool in IntelliJ IDEA; Mr. Stream Trace.

The introduction of Streams in JDK 1.8 was a welcome change in the Java community. It allows developers to express their intent in code better than the good ol’ loop, encourages less mutability and works well with a functional mindset. There are, however, some disadvantages. One thing that bothered me was how hard it is to debug.
Let's say we have the following (admittedly slightly artificial) piece of code:
IntStream.of(1, 2, 3, 4)
    .flatMap(x -> IntStream.of(x + 1, x - 2, x + 3))
    .sorted()
    .distinct()
    .toArray();
Are you able to instantly see what the result of this expression will be? No? Lets try debugging and stepping through each chain in the pipeline.
When learning how to use the Stream API, I had recently learned a super power in IntelliJ: Evaluate expression. I’d mark e.g. the first two lines of code and use my new favorite tool:
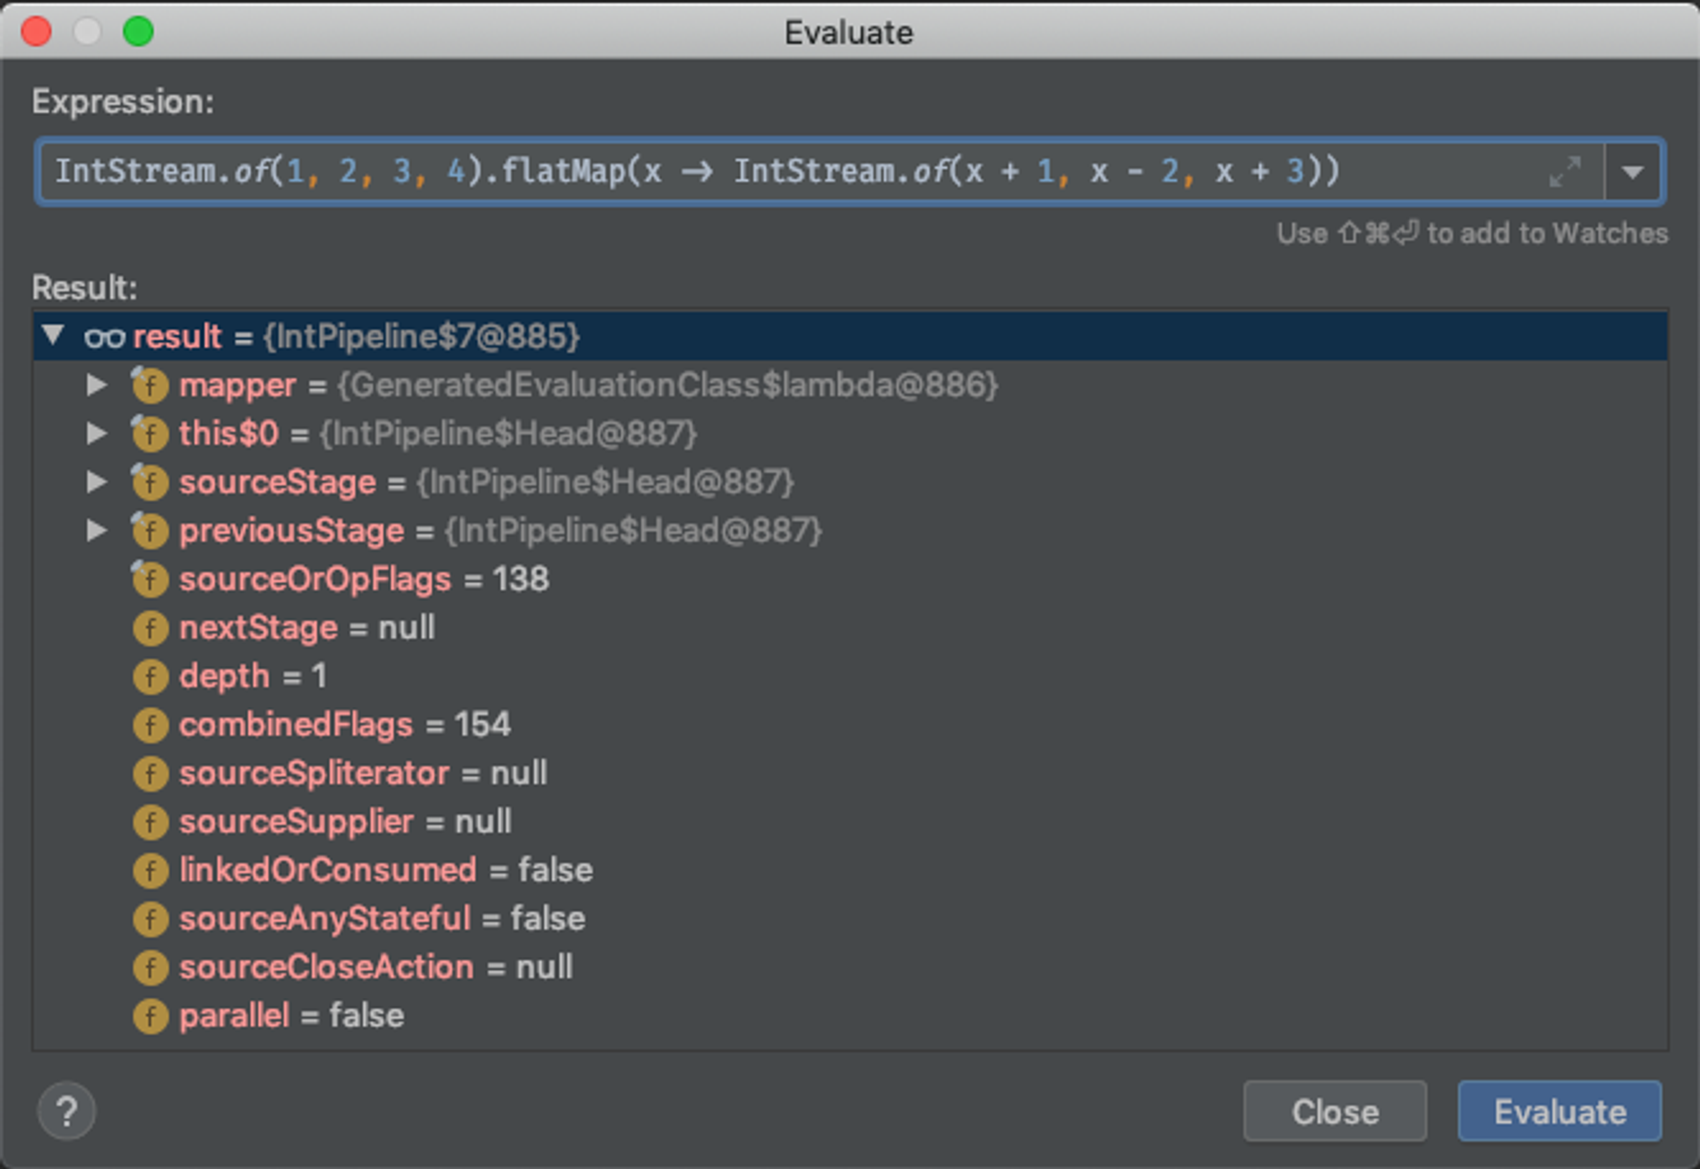
That was … underwhelming. Where are my numbers?! The only thing looking remotely interesting is this$0. Surely this are my numbers, right?
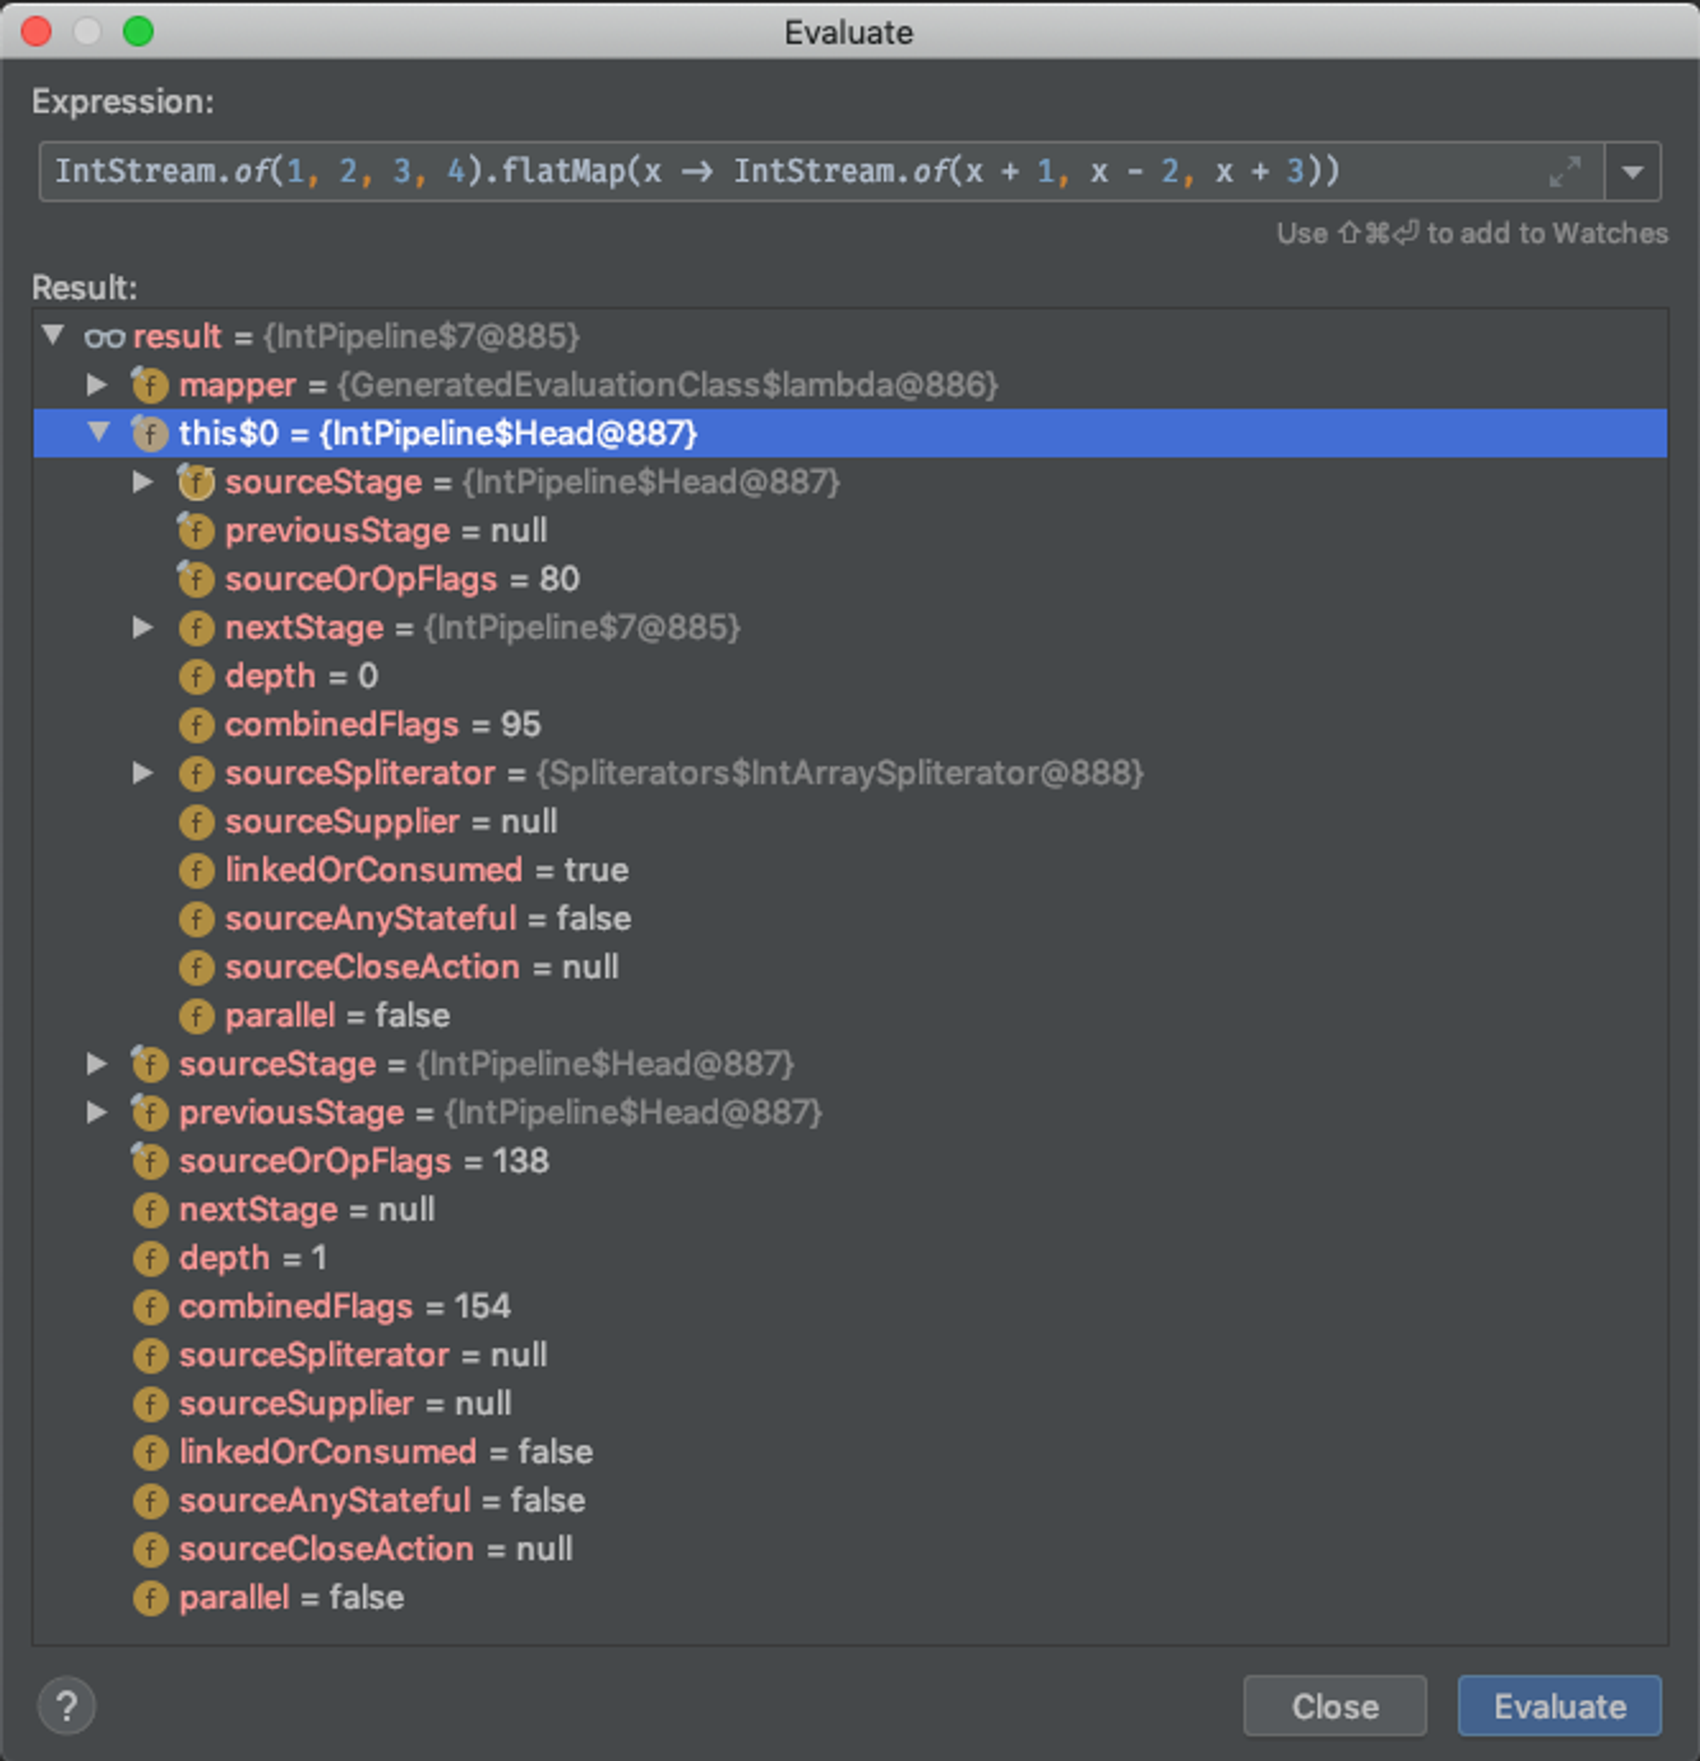
No 🤦♀️
This is because, as we all know, Stream operations are lazy:
Streams are lazy; computation on the source data is only performed when the terminal operation is initiated, and source elements are consumed only as needed. https://docs.oracle.com/javase/8/docs/api/java/util/stream/Stream.html
So I guess I have to perform a terminal operation:
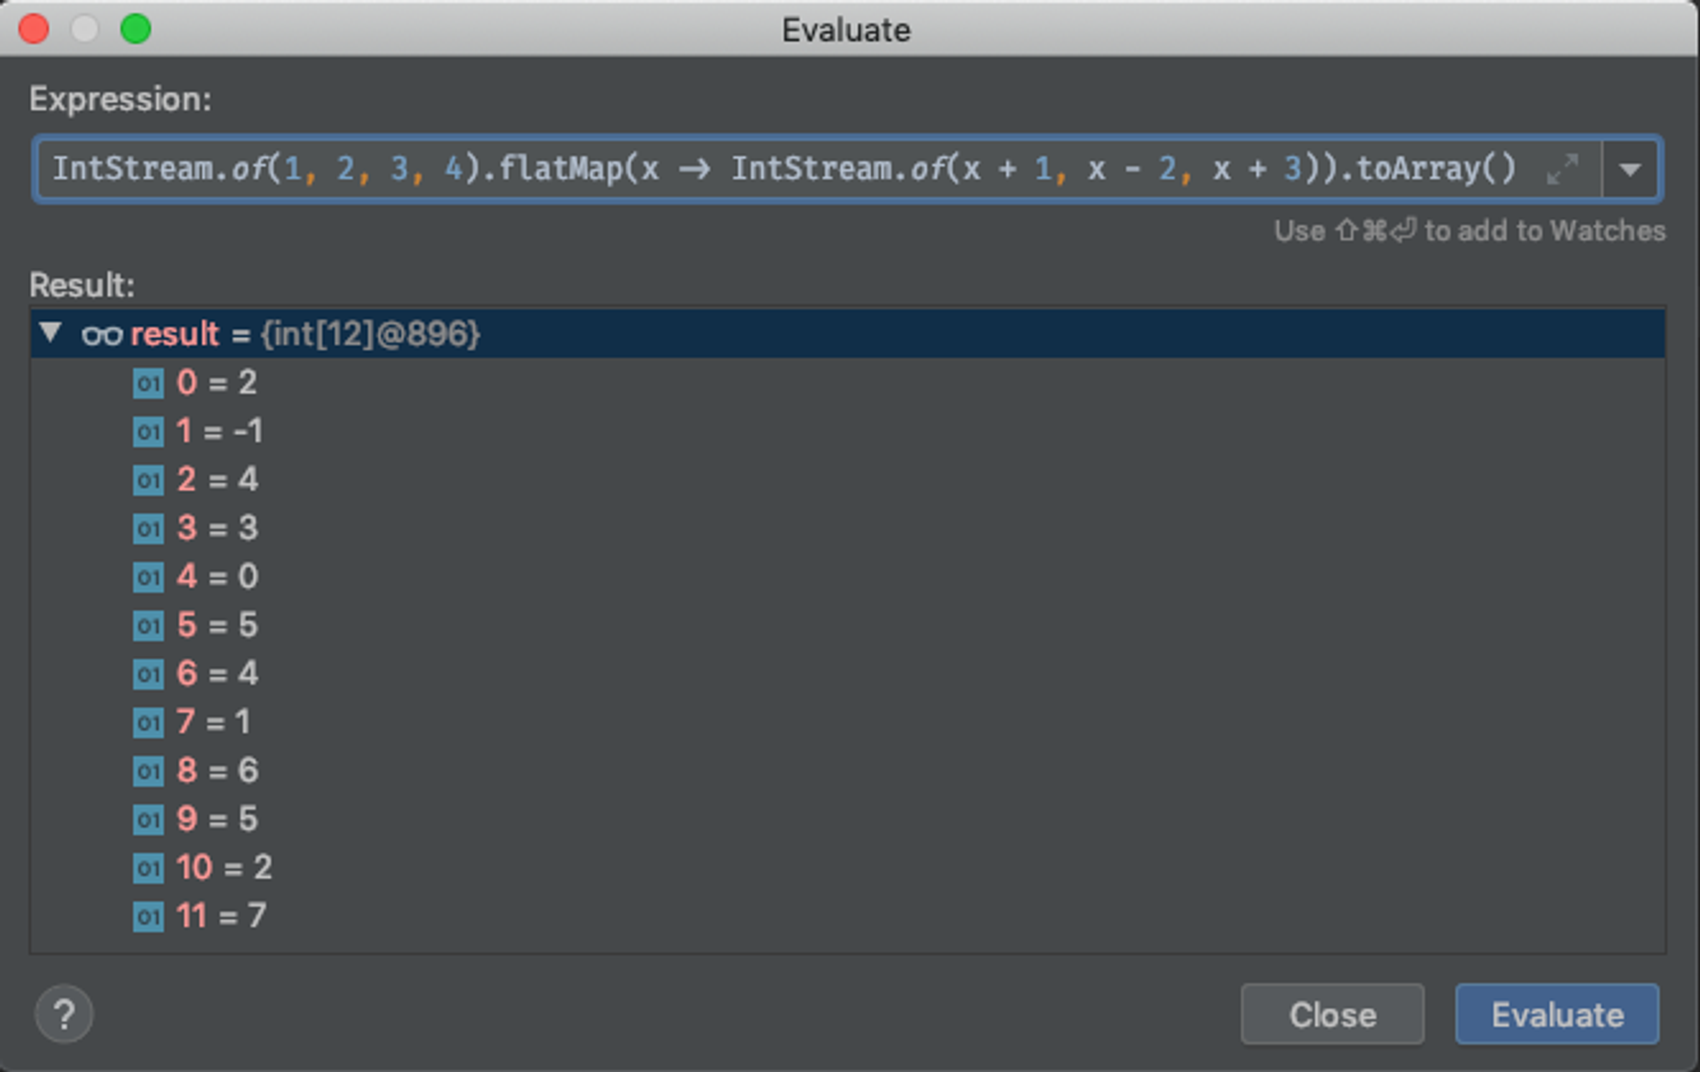
Well, yes, this works. But I can no longer just select the interesting code, press a shortcut and see the results. If I want to figure out what the next step in the pipeline does, I have to close the dialog, increase my selection to the next line, press the Evaluate Expression shortcut and add .toArray() again. I don’t have time for that!
Enter my new favorite feature of IntelliJ: «Trace Current Stream Chain». It’s not the most visible button, but you can find it in the Debug pane:
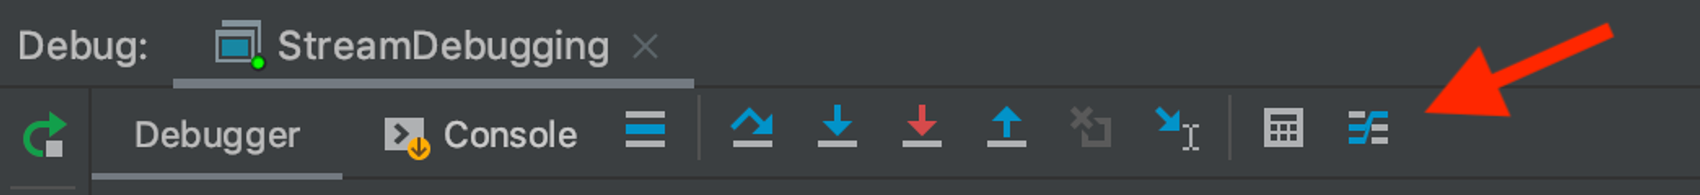
Simply press the magic button (or assign a shortcut!) and you’ll see the following panel:
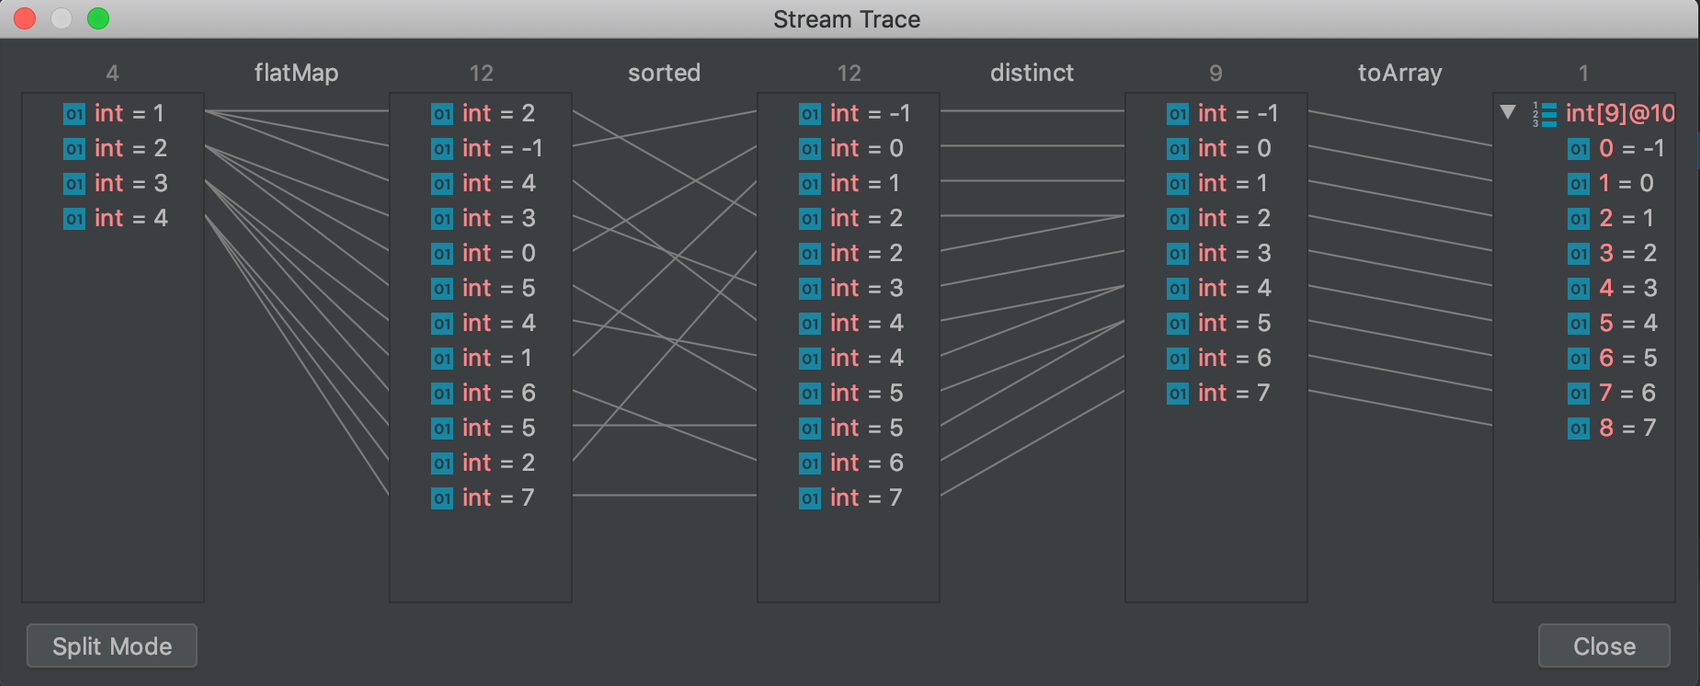
This gives you an overview of the entire pipeline and you can now see the input, every step of the chain and the end result. You can even click an item to see how it changes throughout the pipeline:
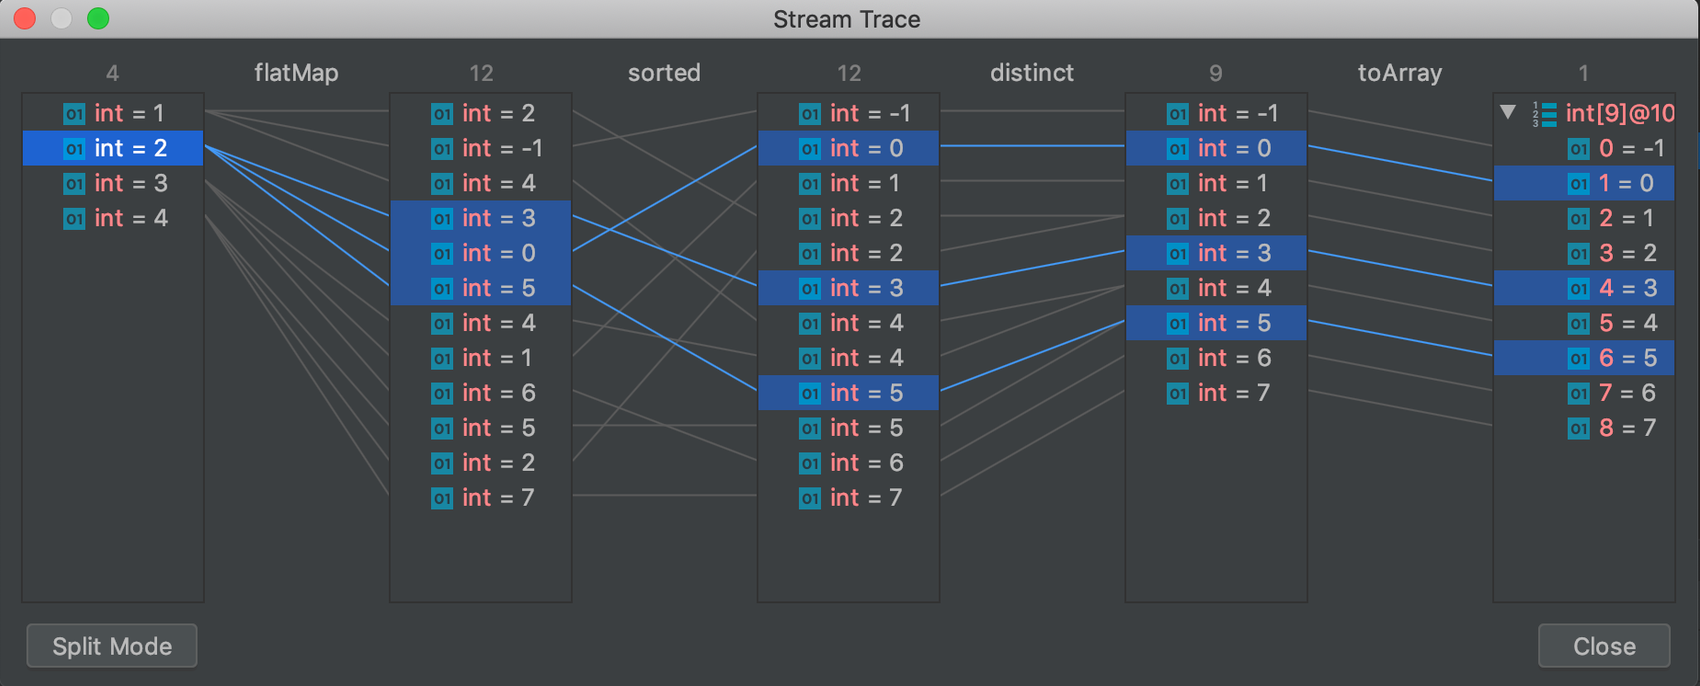
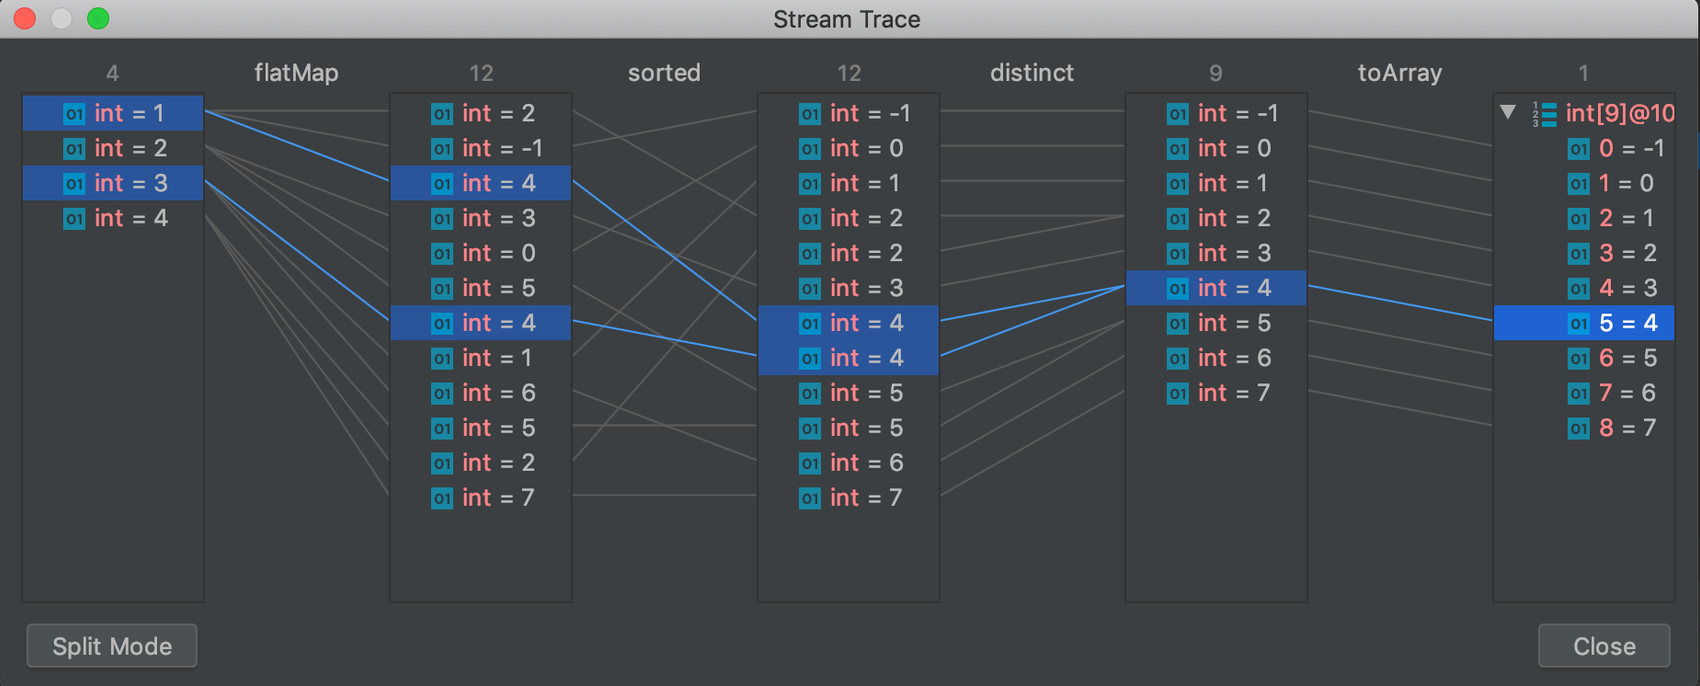
Here I’ve selected the number 2 in the leftmost column. By selecting e.g. the number 4 in the rightmost column you can see how we ended up with that exact number:
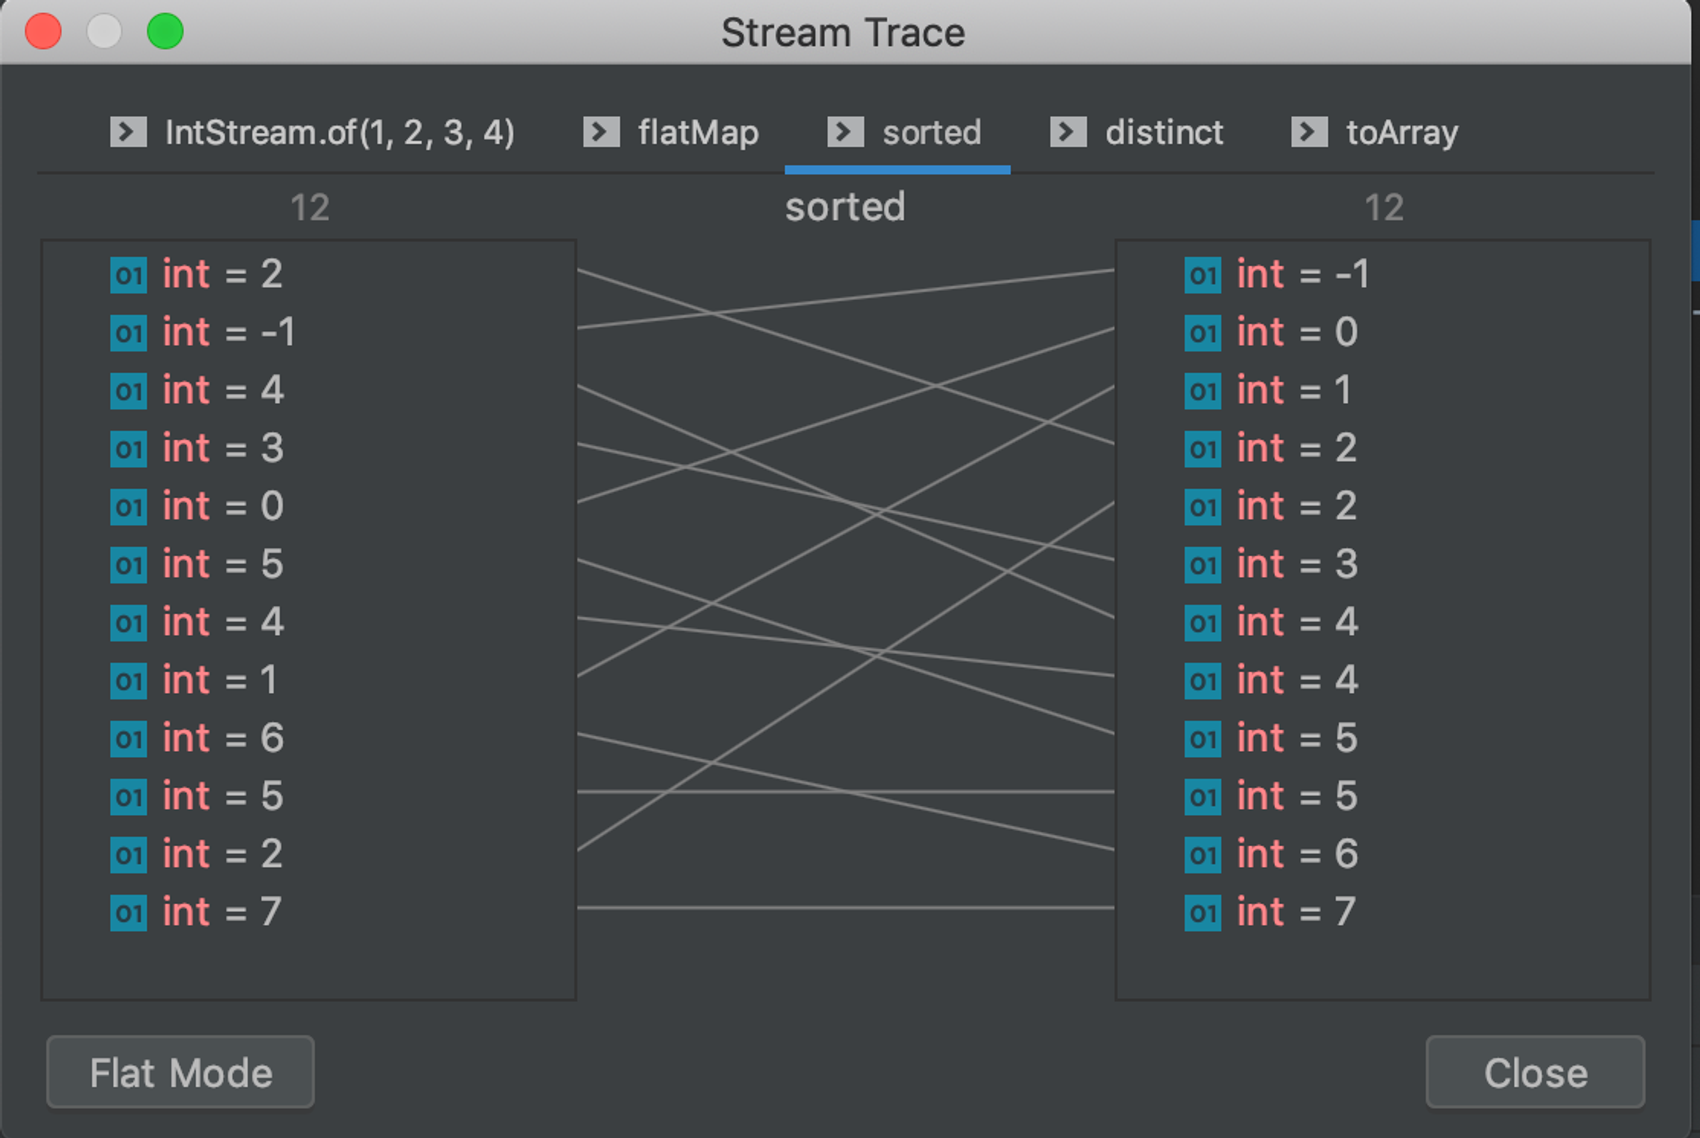
If you have a more complex pipeline with a lot of steps, this flat representation might be too much to take in. In order to concentrate on one single step, press «Split mode» in the bottom left corner and choose the operation you want to have a closer look at:
If you, like me, have found it hard to debug a Stream pipeline I highly suggest you try out the Stream debugger in IntelliJ next time you get lost in the mysterious woods of flatmap and friends.
Happy debugging!