How to use Reactrotron to really improve your React and React Native development

I've primarily been a React or React Native developer for the past three years. During that time you get to experience quite a few things. One of those things is the love/hate relationship with logging and debugging. For me that was especially true while developing for React Native, where errors would apparently origin in the most peculiar and hard-to-figure-out places.
Then, a couple of weeks ago, I learned about Reactotron and thought it looked kinda neat. It's a stand-alone app that connects to your app and greatly improves logging and debugging. Sounds interesting? Let's have a quick look.
Setup and basic usage
After you've followed the guide in the Reactotron repo, installed the app and then --save-dev-ed the package in your project, we are ready to setup Reactotron - which is a breeze. All you need to do is add this piece of code, preferably in your root component:
import Reactotron, { trackGlobalErrors } from "reactotron-react-native";

Reactotron.configure()
  // I'll use React Native in the coding examples here, but
  // the syntax is basically the same for React as well.
  .useReactNative()
  // This isn't mandatory, but I kinda like getting all my
  // errors in one place
  .use(trackGlobalErrors())
  .connect();
With that and a refresh, your Reactotron interface should show a connection. There's not much there just yet though. Let's fix that.
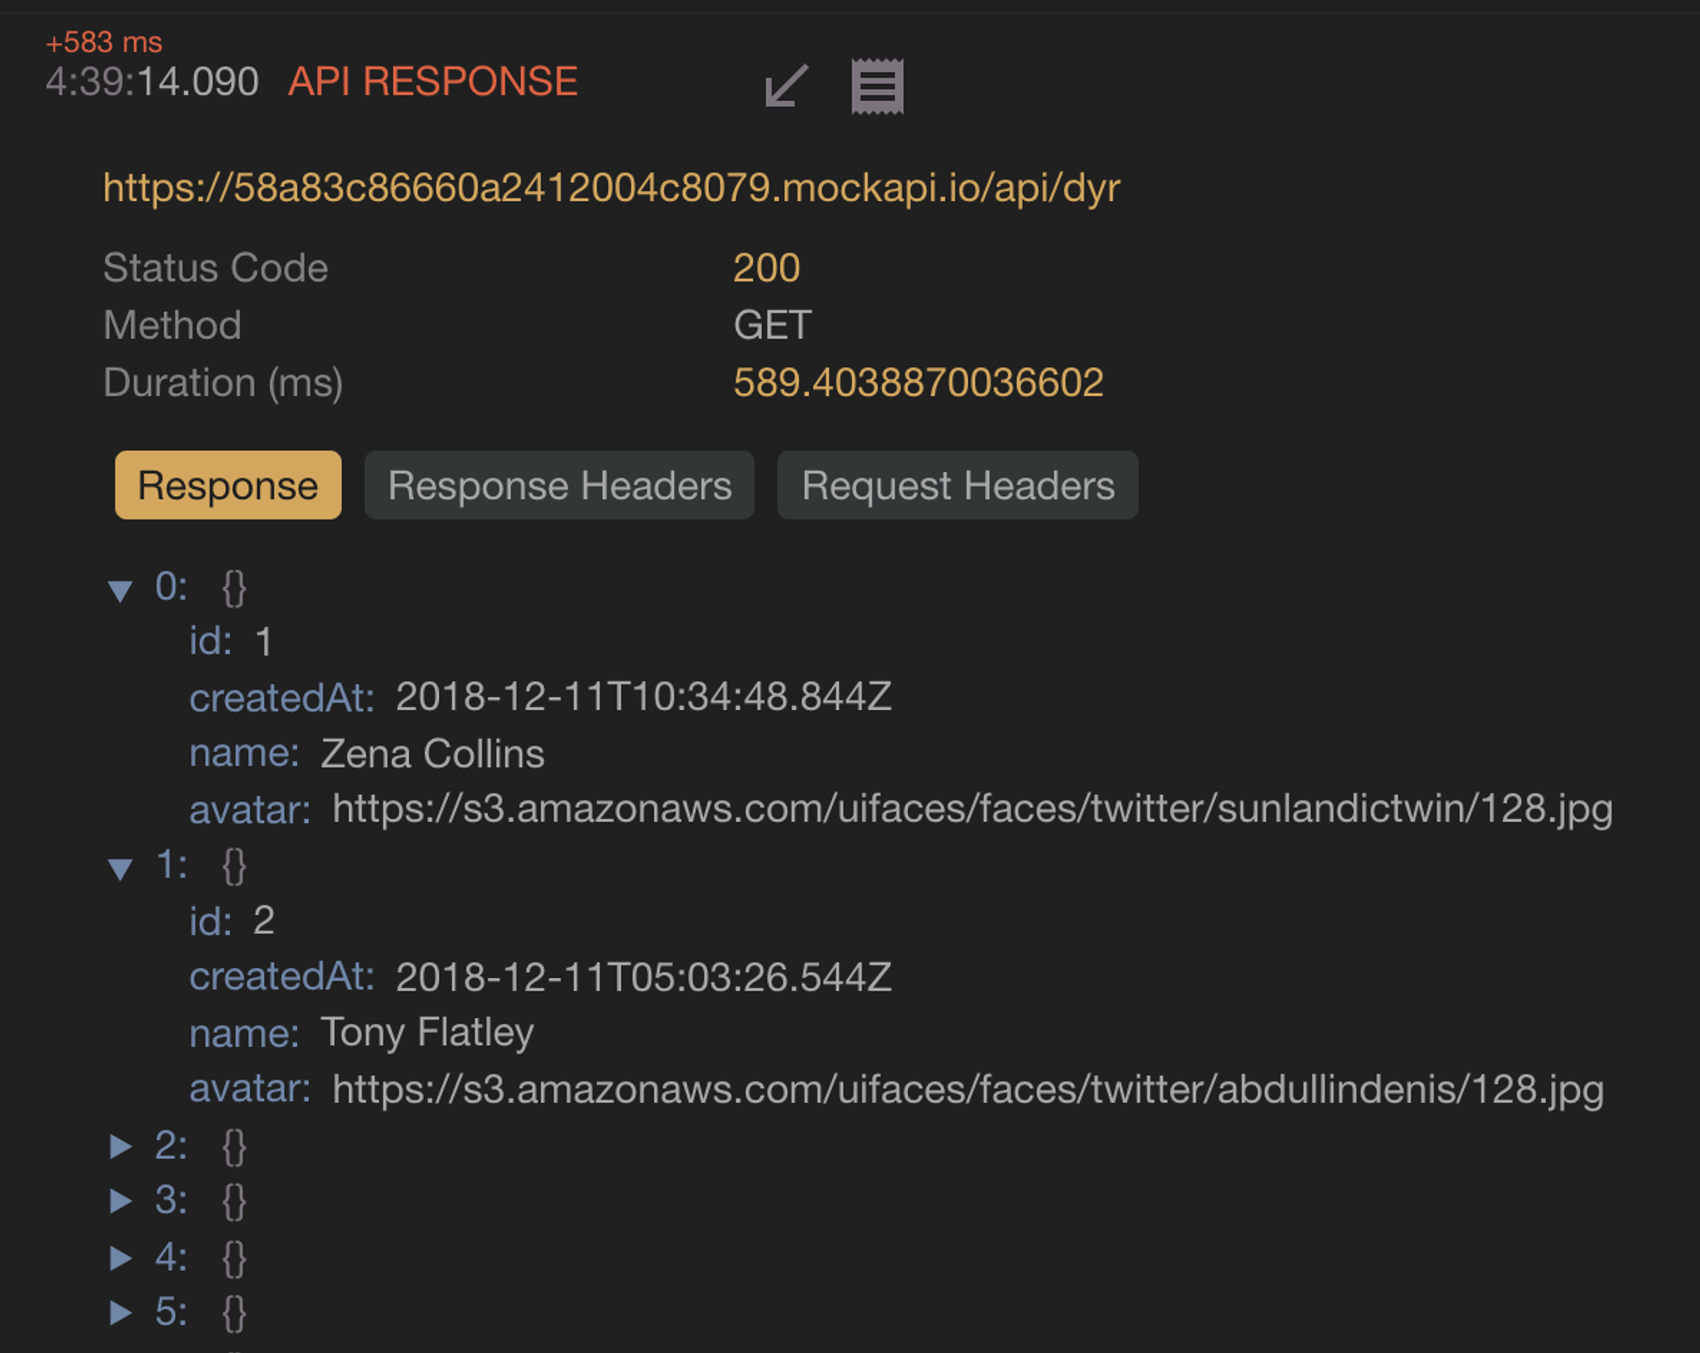
Say if we are requesting data, Reactotron will now know about this and present it way better than console.log-ing the data would. And also you don't need to log it manually at all, which is pretty nice.
Errors
We all write code that doesn't run. It happens. As I mentioned in the beginning I've found that especially React Native sometimes isn't the best at saying what went wrong and where it might have happened.
If I have this:
 componentDidMount() {
    getData()
  }

  async getData() {
    // Getting data...
  }
I've apparently forgotten to bind the function called in componentDidMount to this, resulting in an error. Instead of looking at the dreaded red screen of death you can turn to Reactotron once more, and see this. With a bonus comparison:
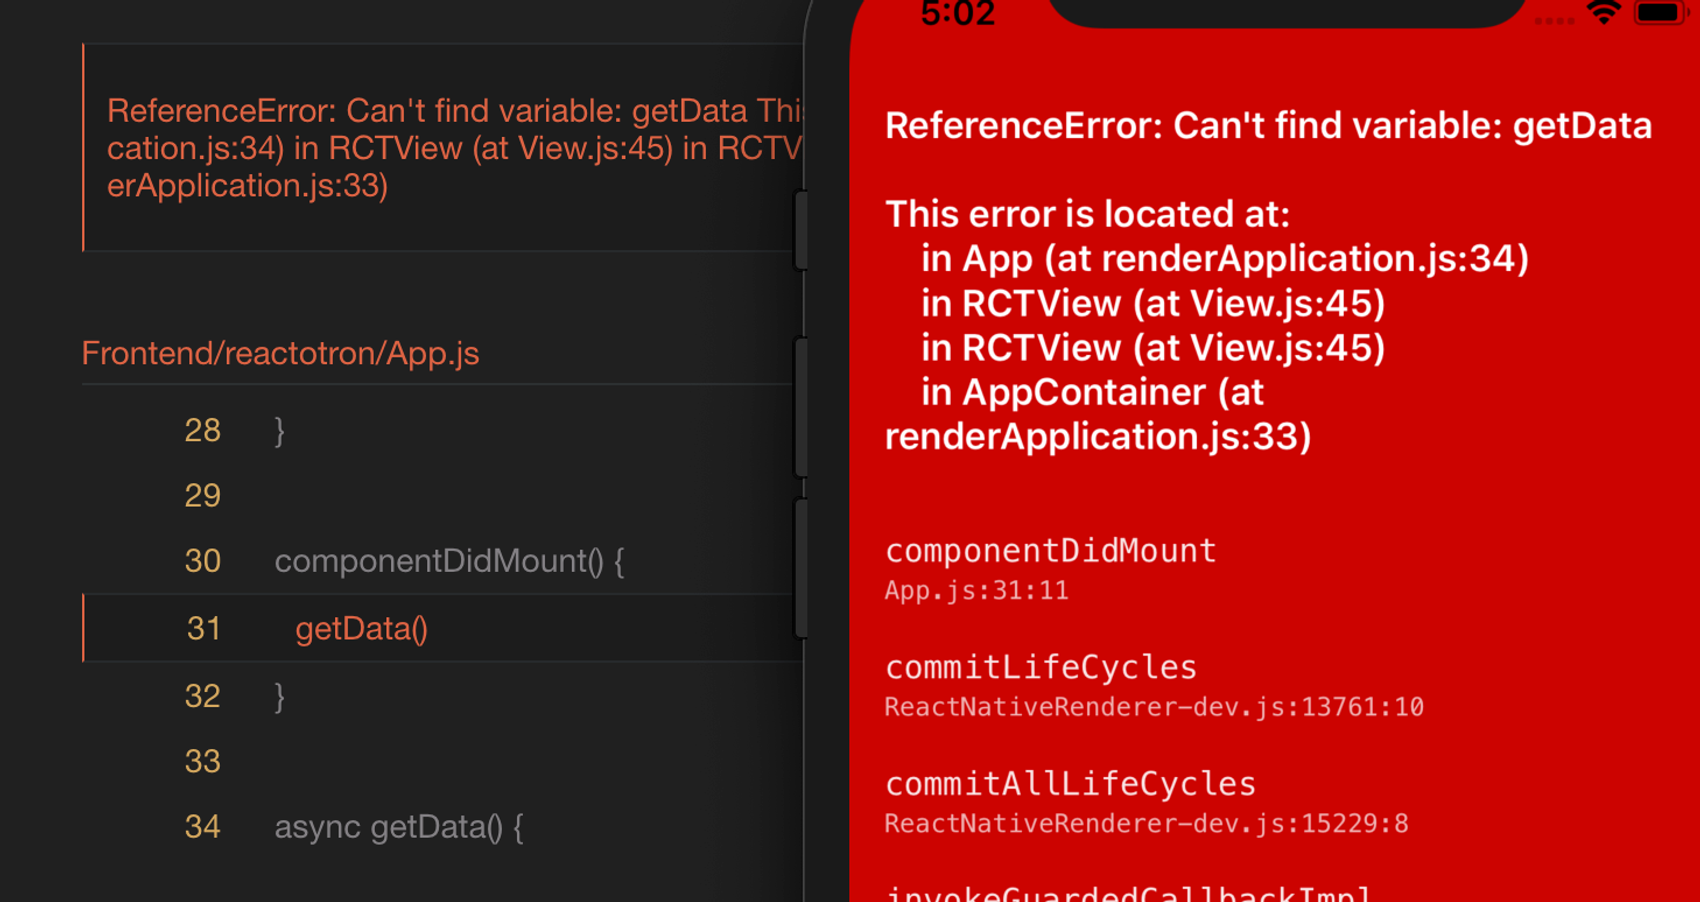
Here you might see in the read screen where the error is located. But I've found Reactotron to be way nicer to work with than this.
Benchmarking
There is also built-in functionality to benchmark your app. You might have slipped on the keyboard and written a function that really affects the rendering. But what is it that makes it so slow?
For the sake of the example, I'm going to use the previous function for getting data from the API, even though this might not be the most common benchmarking use case:
async getData() {
    const response = await fetch('https://example.com/api/persons')

    const data = await response.json()

    this.setState({
      data
    })
}
If we want to benchmark this function we can expand the code to this:
async getData() {
const bm = Reactotron.benchmark('Checking my slow function')
const response = await fetch('https://example.com/api/persons')
bm.step("Step 1: Getting data from api")
const data = await response.json()
bm.step("Step 2: Parsing data")
this.setState({
data
}, () => {
// Note that this last function is called stop, not step
bm.stop("Step 3: Put parsed data in state")
})
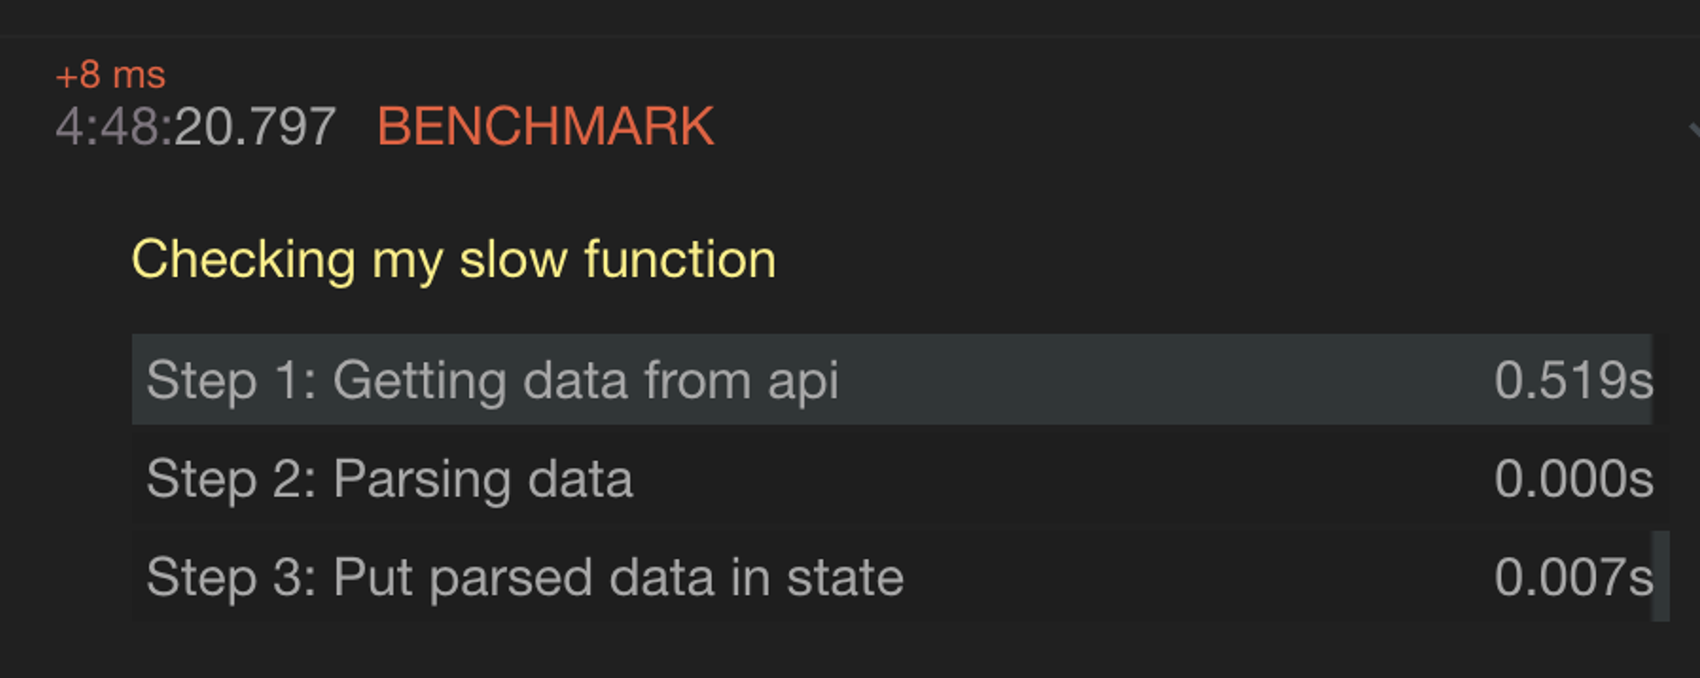
}Reactotron will then show us something like this:
Is that it?
Not at all. Reactotron has plenty of more functionality. You can track all network requests, async storage, state changes and more. You can connect your Redux or your MobX.
If you feel that something is missing and feel like contributing you can even write your own plugins!
Have a go at it and see if it's something that might improve your workflow.